Note
Go to the end to download the full example code.
Shell Static Analysis#
Visualize a shell static analysis
# download the pontoon example
from ansys.mapdl.reader import examples

pontoon = examples.download_pontoon()
Print the pontoon result
print(pontoon)
PyMAPDL Result
Title       : CASE  1001  'H =  1.0  T =  62.8  D =  -0.0  P =   0.0'
Units       : User Defined
Version     : 19.3
Cyclic      : False
Result Sets : 1
Nodes       : 8765
Elements    : 8640


Available Results:
EMS : Miscellaneous summable items (normally includes face pressures)
ENF : Nodal forces
ENS : Nodal stresses
ENG : Element energies and volume
EEL : Nodal elastic strains
ETH : Nodal thermal strains (includes swelling strains)
EUL : Element euler angles
EPT : Nodal temperatures
NSL : Nodal displacements
RF  : Nodal reaction forces
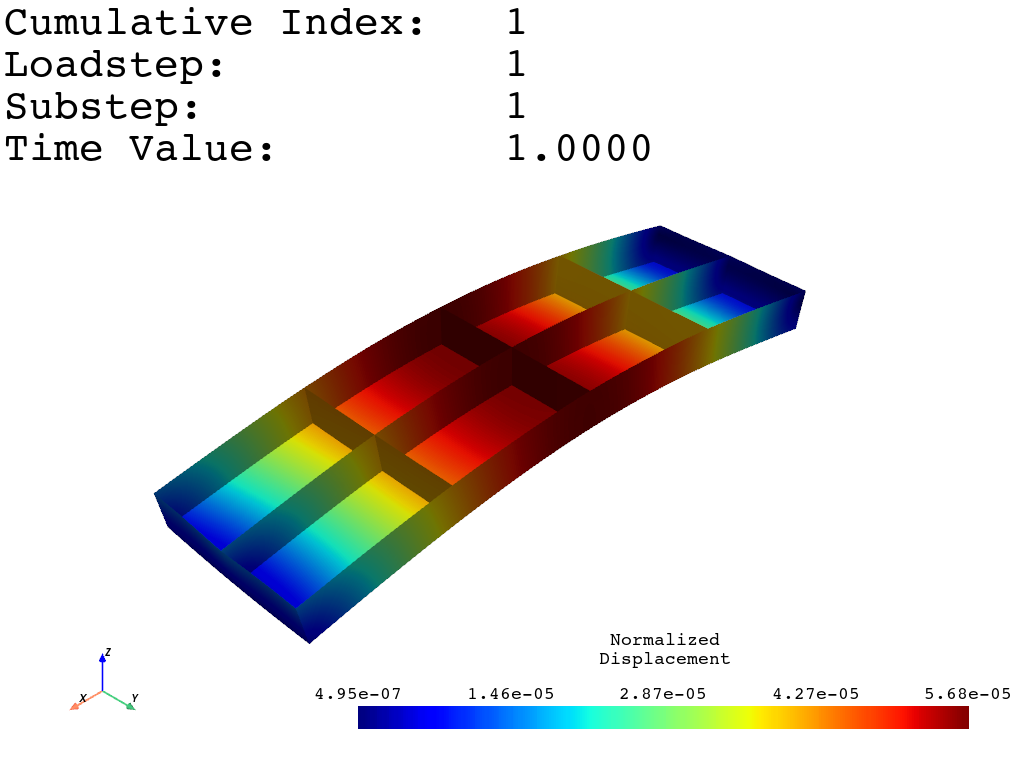
Plot the nodal displacement
pontoon.plot_nodal_solution(0, show_displacement=True, displacement_factor=100000)
/home/runner/work/pymapdl-reader/pymapdl-reader/.venv/lib/python3.14/site-packages/ansys/mapdl/reader/rst.py:3044: PyVistaFutureWarning: The default value of `algorithm` for the filter
`UnstructuredGrid.extract_surface` will change in the future. It currently defaults to
`'dataset_surface'`, but will change to `None`. Explicitly set the `algorithm` keyword to
silence this warning.
  mesh = grid.extract_surface()
print the available result types
pontoon.available_results
Available Results:
EMS : Miscellaneous summable items (normally includes face pressures)
ENF : Nodal forces
ENS : Nodal stresses
ENG : Element energies and volume
EEL : Nodal elastic strains
ETH : Nodal thermal strains (includes swelling strains)
EUL : Element euler angles
EPT : Nodal temperatures
NSL : Nodal displacements
RF  : Nodal reaction forces
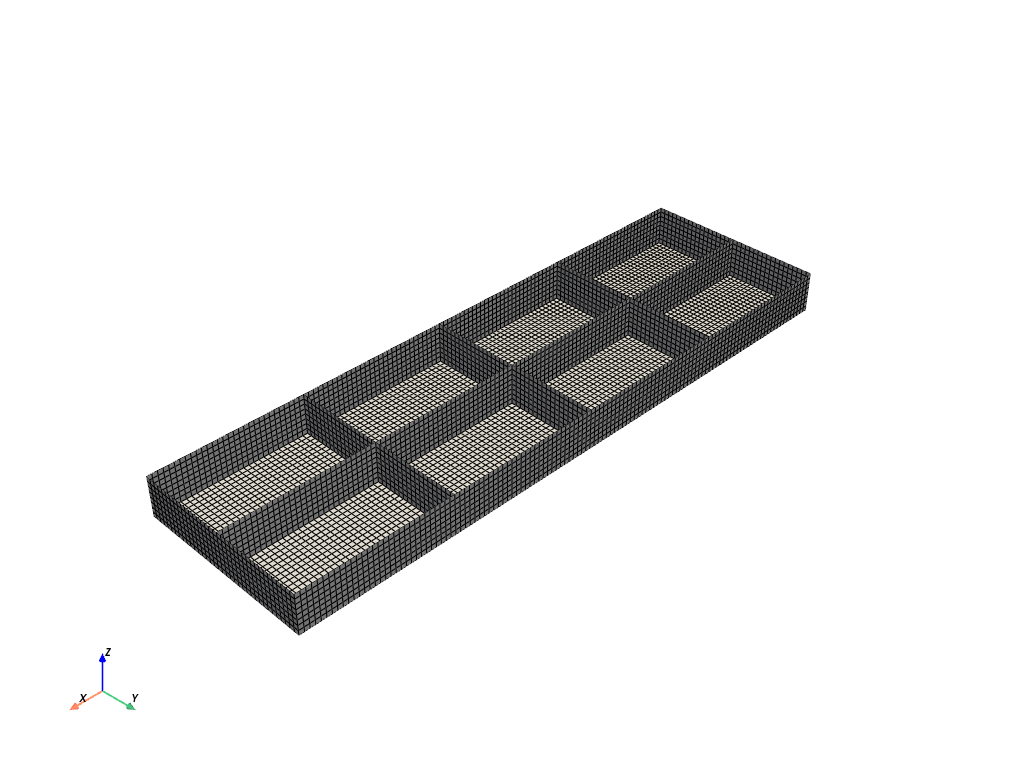
Plot the shell elements
pontoon.plot()
/home/runner/work/pymapdl-reader/pymapdl-reader/.venv/lib/python3.14/site-packages/ansys/mapdl/reader/rst.py:3044: PyVistaFutureWarning: The default value of `algorithm` for the filter
`UnstructuredGrid.extract_surface` will change in the future. It currently defaults to
`'dataset_surface'`, but will change to `None`. Explicitly set the `algorithm` keyword to
silence this warning.
  mesh = grid.extract_surface()
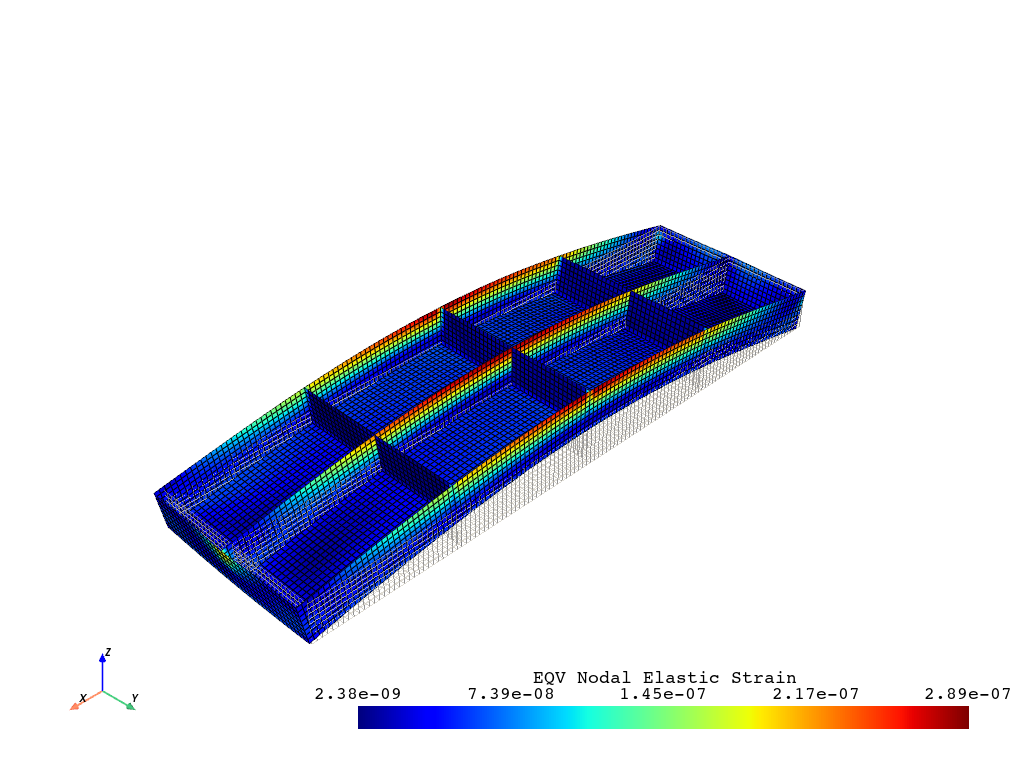
Plot the elastic strain and show exaggerated displacement
pontoon.plot_nodal_elastic_strain(
    0,
    "eqv",
    show_displacement=True,
    displacement_factor=100000,
    overlay_wireframe=True,
    lighting=False,
    add_text=False,
    show_edges=True,
)
# Note: lighting is disabled here as it's too dark
/home/runner/work/pymapdl-reader/pymapdl-reader/.venv/lib/python3.14/site-packages/ansys/mapdl/reader/rst.py:3044: PyVistaFutureWarning: The default value of `algorithm` for the filter
`UnstructuredGrid.extract_surface` will change in the future. It currently defaults to
`'dataset_surface'`, but will change to `None`. Explicitly set the `algorithm` keyword to
silence this warning.
  mesh = grid.extract_surface()
Total running time of the script: (0 minutes 0.647 seconds)