Note
Go to the end to download the full example code.
Understanding Nodal Diameters from a Cyclic Model Analysis#
This example shows how to interpret modes from a cyclic analysis from MAPDL result file from both single bladed sectors as well as multi-bladed sectors from a modal analysis.
# sphinx_gallery_thumbnail_number = 2

import numpy as np

from ansys.mapdl.reader import examples
Download the academic modal analysis file
rotor = examples.download_academic_rotor_result()
print(rotor)
PyMAPDL Result
Units       : User Defined
Version     : 20.1
Cyclic      : True
Result Sets : 26
Nodes       : 786
Elements    : 524


Available Results:
EMS : Miscellaneous summable items (normally includes face pressures)
ENF : Nodal forces
ENS : Nodal stresses
ENG : Element energies and volume
EEL : Nodal elastic strains
ETH : Nodal thermal strains (includes swelling strains)
EUL : Element euler angles
EPT : Nodal temperatures
NSL : Nodal displacements
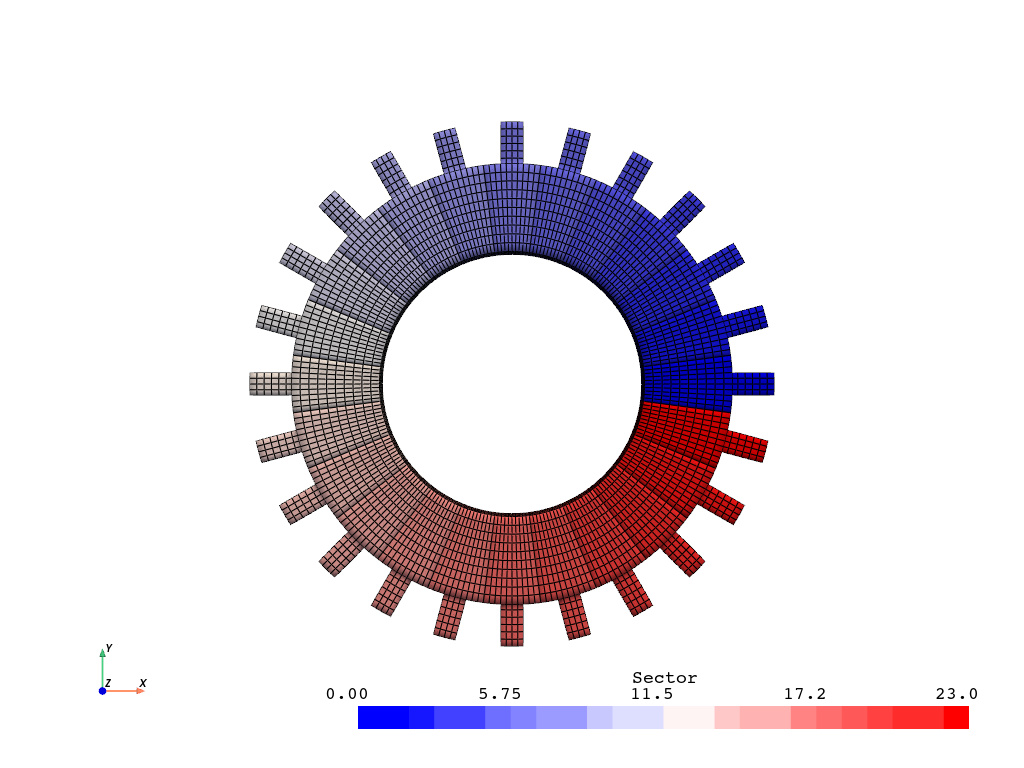
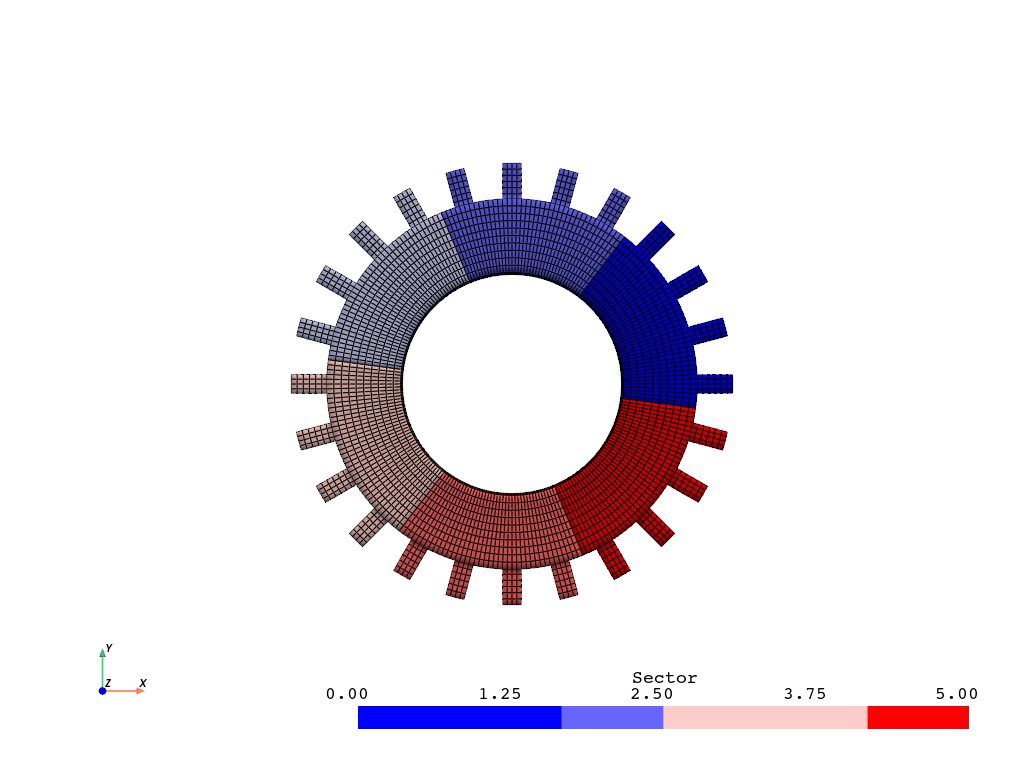
Rotor Sector Order#
Note that the sector rotations follow the right-hand rule where the X-axis and Y-axis make up the horizontal plane and the Z-axis is vertical and positive upwards. Rotation follows the right-hand rule, which looks anti-clockwise when looking downward onto the XY plane.
_ = rotor.plot_sectors(
    cpos="xy", scalar_bar_args={"title": "Sector"}, smooth_shading=True, cmap="bwr"
)
/home/runner/work/pymapdl-reader/pymapdl-reader/.venv/lib/python3.14/site-packages/ansys/mapdl/reader/cyclic_reader.py:1993: PyVistaFutureWarning: The default value of `algorithm` for the filter
`UnstructuredGrid.extract_surface` will change in the future. It currently defaults to
`'dataset_surface'`, but will change to `None`. Explicitly set the `algorithm` keyword to
silence this warning.
  surf_sector = grid.extract_surface()
/home/runner/work/pymapdl-reader/pymapdl-reader/.venv/lib/python3.14/site-packages/ansys/mapdl/reader/cyclic_reader.py:2003: PyVistaDeprecationWarning:
/home/runner/work/pymapdl-reader/pymapdl-reader/.venv/lib/python3.14/site-packages/ansys/mapdl/reader/cyclic_reader.py:2003: Argument 'deep' must be passed as a keyword argument to function 'DataObject.copy'.
From version 0.50, passing this as a positional argument will result in a TypeError.
  surf_sector.copy(False), scalars=sector_scalars, **kwargs
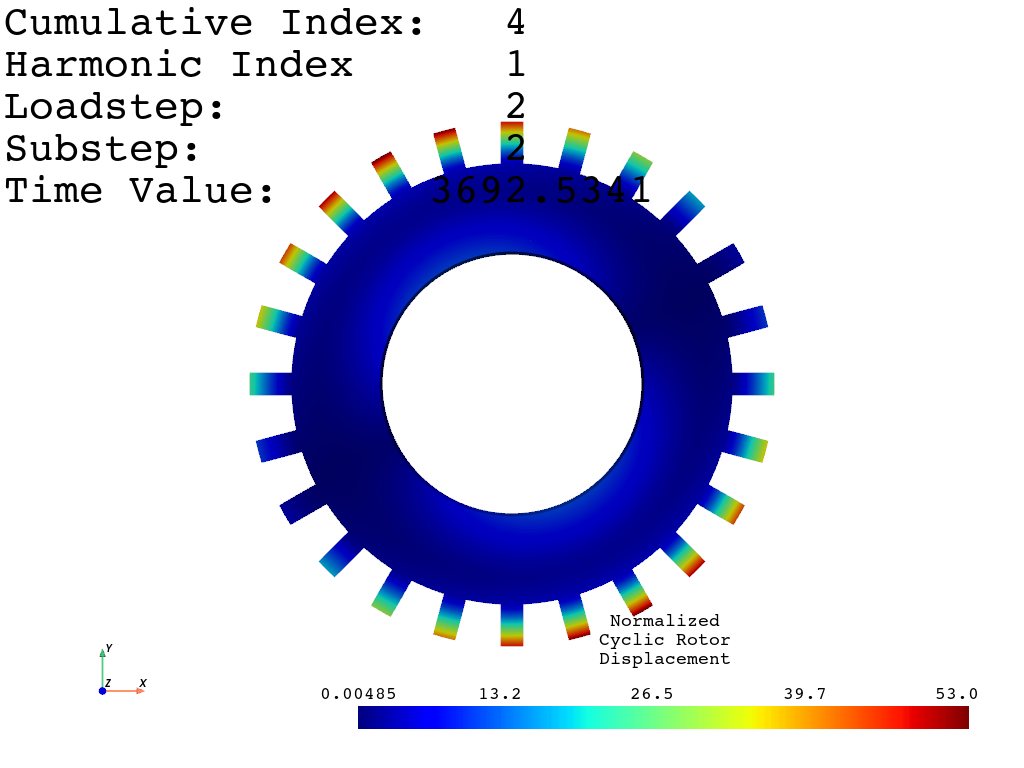
Plot Nodal Displacement
This modal analysis contains two modes for each harmonic index. Since this is a 24 sector rotor, it will contain the harmonic indices from 0 to N/2, which in this case is 12
# Print the harmonic indices with
print(rotor.harmonic_indices)
[  0   0  -1   1  -2   2   3  -3   4  -4   5  -5   6  -6   7  -7   8  -8
   9  -9  10 -10  11 -11  12  12]
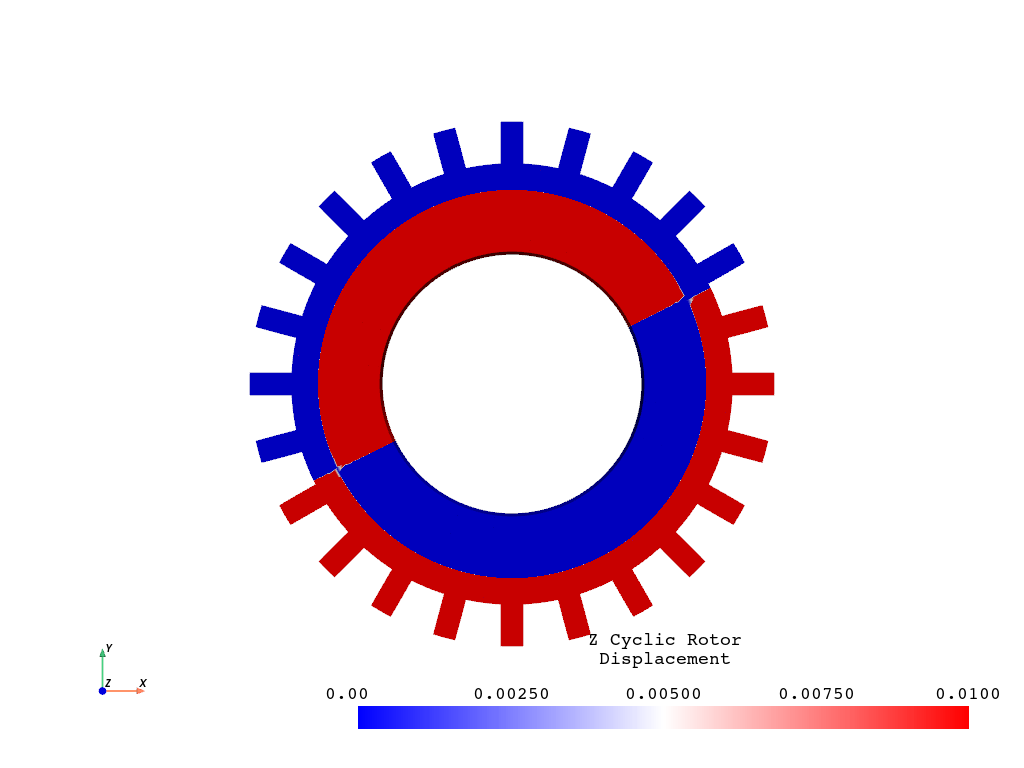
You can refer to the result set either using MAPDL’s 1-based indexing which is (Load-step, sub-step).
_ = rotor.plot_nodal_displacement((2, 2), comp="norm", cpos="xy")
/home/runner/work/pymapdl-reader/pymapdl-reader/.venv/lib/python3.14/site-packages/ansys/mapdl/reader/cyclic_reader.py:1993: PyVistaFutureWarning: The default value of `algorithm` for the filter
`UnstructuredGrid.extract_surface` will change in the future. It currently defaults to
`'dataset_surface'`, but will change to `None`. Explicitly set the `algorithm` keyword to
silence this warning.
  surf_sector = grid.extract_surface()
/home/runner/work/pymapdl-reader/pymapdl-reader/.venv/lib/python3.14/site-packages/ansys/mapdl/reader/cyclic_reader.py:2003: PyVistaDeprecationWarning:
/home/runner/work/pymapdl-reader/pymapdl-reader/.venv/lib/python3.14/site-packages/ansys/mapdl/reader/cyclic_reader.py:2003: Argument 'deep' must be passed as a keyword argument to function 'DataObject.copy'.
From version 0.50, passing this as a positional argument will result in a TypeError.
  surf_sector.copy(False), scalars=sector_scalars, **kwargs
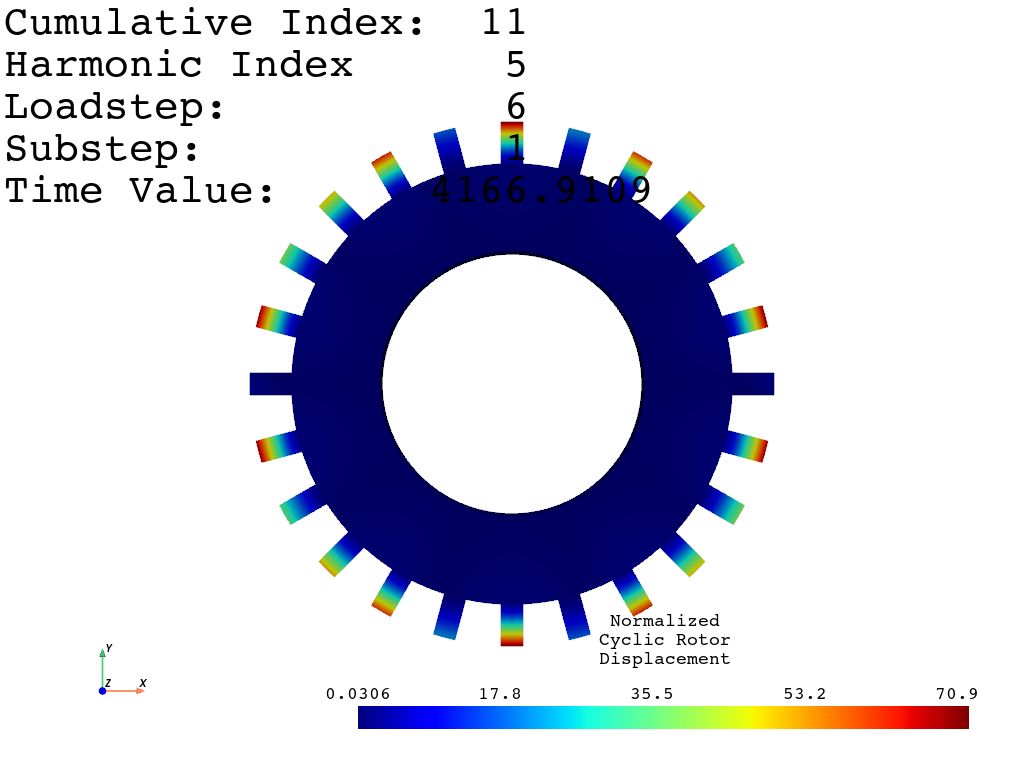
Alternatively, you can refer to the results using cumulative indexing.
_ = rotor.plot_nodal_displacement(10, comp="norm", cpos="xy")
/home/runner/work/pymapdl-reader/pymapdl-reader/.venv/lib/python3.14/site-packages/ansys/mapdl/reader/cyclic_reader.py:1993: PyVistaFutureWarning: The default value of `algorithm` for the filter
`UnstructuredGrid.extract_surface` will change in the future. It currently defaults to
`'dataset_surface'`, but will change to `None`. Explicitly set the `algorithm` keyword to
silence this warning.
  surf_sector = grid.extract_surface()
/home/runner/work/pymapdl-reader/pymapdl-reader/.venv/lib/python3.14/site-packages/ansys/mapdl/reader/cyclic_reader.py:2003: PyVistaDeprecationWarning:
/home/runner/work/pymapdl-reader/pymapdl-reader/.venv/lib/python3.14/site-packages/ansys/mapdl/reader/cyclic_reader.py:2003: Argument 'deep' must be passed as a keyword argument to function 'DataObject.copy'.
From version 0.50, passing this as a positional argument will result in a TypeError.
  surf_sector.copy(False), scalars=sector_scalars, **kwargs
Understanding Harmonic Indexing#
ANSYS has great documentation on harmonic indexing within their internal documentation, but for the sake of completeness it will be repeated here.
The harmonic index used within MAPDL is an integer that determines the variation in the value of a single degree of freedom at points spaced at a circumferential angle equal to the sector angle.
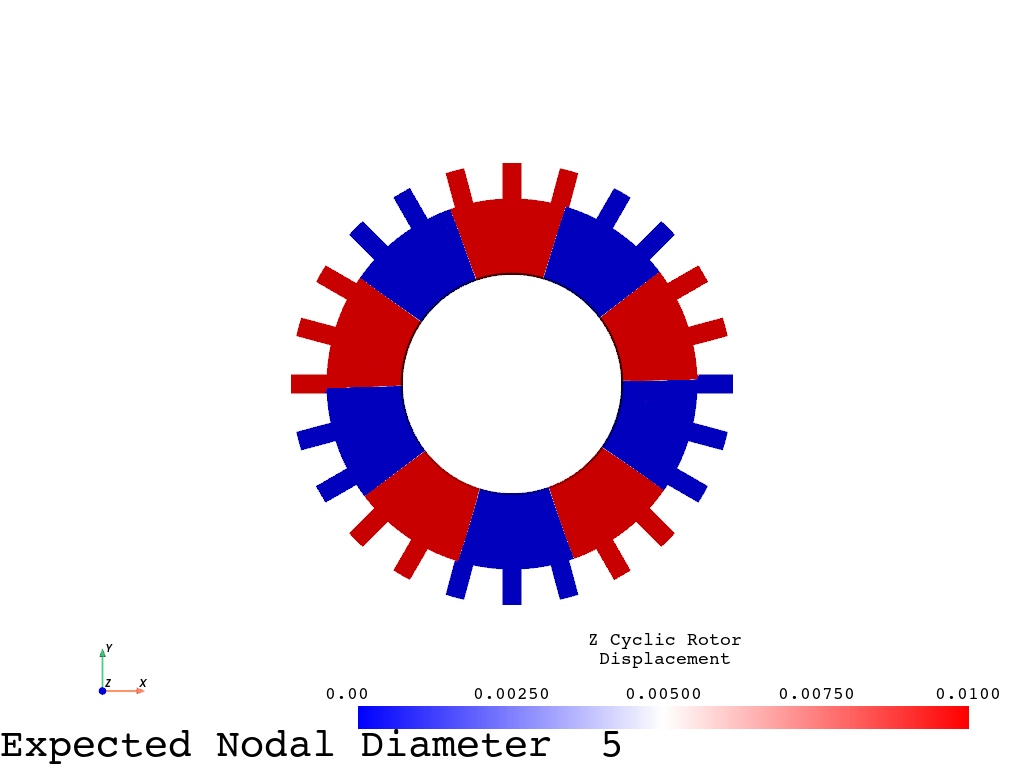
For this academic rotor, when the number of “blades” equals the number of MAPDL sectors, the harmonic index will always match the nodal diameter. For example, the cumulative result 10 has a harmonic index of 5:
rnum = 10
print("Harmonic Index:", rotor.harmonic_indices[rnum])
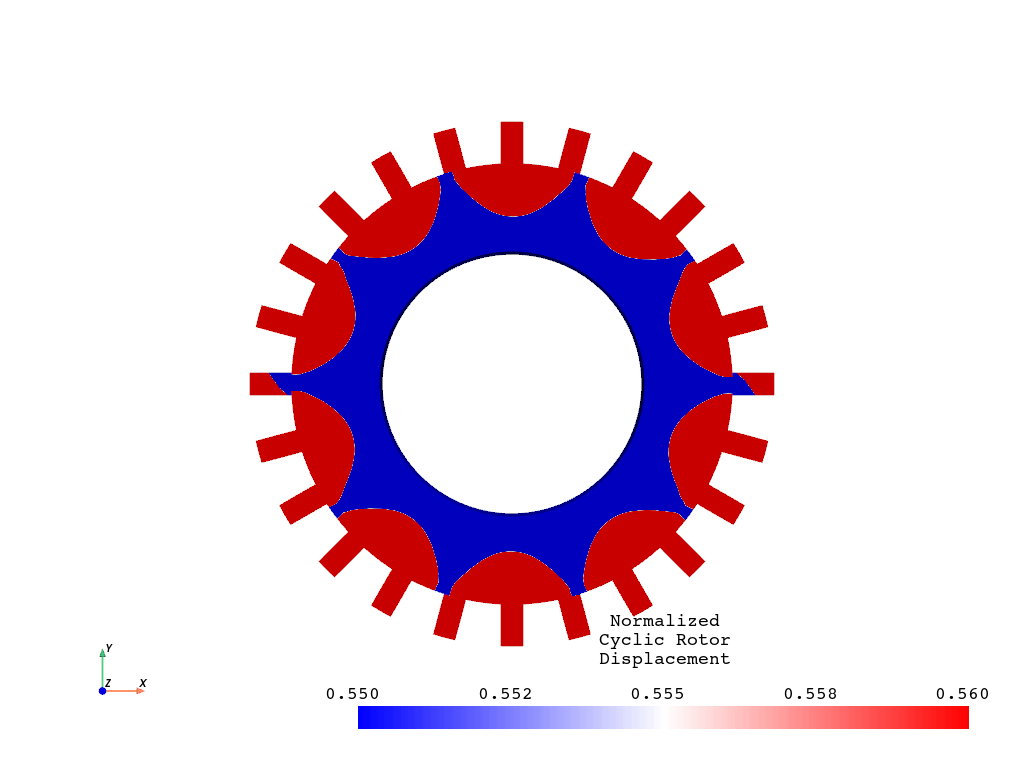
# For the purpose of illustrating the nodal diameter content, we
# restrict the displacement to a narrow range and force the lower and
# upper ranges of the plot to indicate the phase of the displacement
#
# In this plot you can clearly see that the harmonic index is indeed 5
# as five, and only 5 lines can be drawn through the node lines
# spanning the circumference of the rotor.
r = 0.55
_ = rotor.plot_nodal_displacement(
rnum,
comp="norm",
cpos="xy",
rng=[r, r + 1e-2],
scalar_bar_args={"title": ""},
add_text=False,
cmap="bwr",
)
Harmonic Index: 5
/home/runner/work/pymapdl-reader/pymapdl-reader/.venv/lib/python3.14/site-packages/ansys/mapdl/reader/cyclic_reader.py:1993: PyVistaFutureWarning: The default value of `algorithm` for the filter
`UnstructuredGrid.extract_surface` will change in the future. It currently defaults to
`'dataset_surface'`, but will change to `None`. Explicitly set the `algorithm` keyword to
silence this warning.
  surf_sector = grid.extract_surface()
/home/runner/work/pymapdl-reader/pymapdl-reader/.venv/lib/python3.14/site-packages/ansys/mapdl/reader/cyclic_reader.py:2003: PyVistaDeprecationWarning:
/home/runner/work/pymapdl-reader/pymapdl-reader/.venv/lib/python3.14/site-packages/ansys/mapdl/reader/cyclic_reader.py:2003: Argument 'deep' must be passed as a keyword argument to function 'DataObject.copy'.
From version 0.50, passing this as a positional argument will result in a TypeError.
  surf_sector.copy(False), scalars=sector_scalars, **kwargs
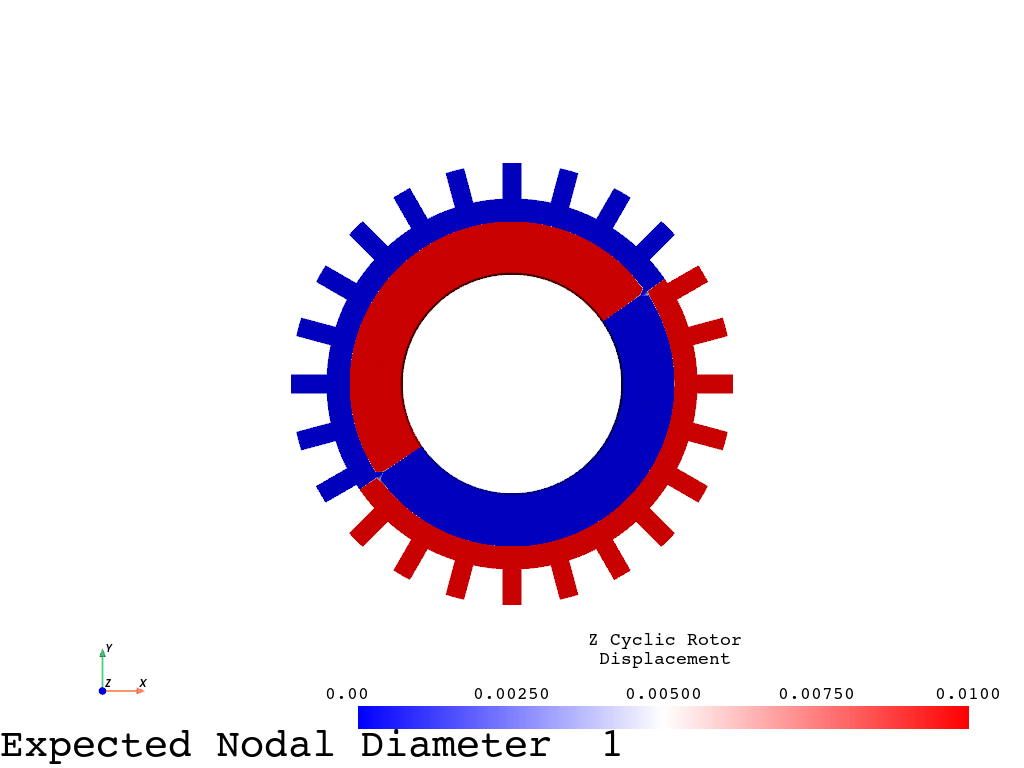
The same can be done for the simpler nodal diameter 1
rnum = 3
print(rotor.harmonic_indices[rnum])

r = 0
_ = rotor.plot_nodal_displacement(
    rnum,
    comp="z",
    cpos="xy",
    rng=[r, r + 1e-2],
    add_text=False,
    scalar_bar_args={"title": ""},
    cmap="bwr",
)


# Therefore for this rotor with the number of sectors (N) equaling the
# number of blades, for each harmonic index there can only be one
# corresponding nodal diameter
1
/home/runner/work/pymapdl-reader/pymapdl-reader/.venv/lib/python3.14/site-packages/ansys/mapdl/reader/cyclic_reader.py:1993: PyVistaFutureWarning: The default value of `algorithm` for the filter
`UnstructuredGrid.extract_surface` will change in the future. It currently defaults to
`'dataset_surface'`, but will change to `None`. Explicitly set the `algorithm` keyword to
silence this warning.
  surf_sector = grid.extract_surface()
/home/runner/work/pymapdl-reader/pymapdl-reader/.venv/lib/python3.14/site-packages/ansys/mapdl/reader/cyclic_reader.py:2003: PyVistaDeprecationWarning:
/home/runner/work/pymapdl-reader/pymapdl-reader/.venv/lib/python3.14/site-packages/ansys/mapdl/reader/cyclic_reader.py:2003: Argument 'deep' must be passed as a keyword argument to function 'DataObject.copy'.
From version 0.50, passing this as a positional argument will result in a TypeError.
  surf_sector.copy(False), scalars=sector_scalars, **kwargs
Multi-Bladed Sectors#
When there are multiple blades per sector as in the case of the following example, the relationship between the harmonic indices and nodal diameters becomes more complicated
In this case, we use the following equation described in the MAPDL Cyclic Analysis Guide: d = m*N ± k
where: - d is the nodal diameter - N is the number of sectors - k is the harmonic index - m is a set of integers from 0 to infinity
Therefore, for a 6 sector rotor, the first 4 possible nodal diameters at harmonic index 1 are:
Nodal Diameters :
   1
   5
   7
  11
  13
  17
  19
  23
  25
Normally for a rotor where the number of blades per sector is 1, nodal diameters higher than N are simply aliased back to 1 and these solutions do not appear in the results. However, when the sector contains multiple blades per sector, these results do appear in the analysis since they are not aliased back into a repeated mode.
# Therefore in this example part of the above modes will be
# back-aliased for a 24 blade, 6 sector rotor, and these can be
# computed with:

n_blades = 24  # 4 blades per sector
nodal_diameters = []
for m in range(5):
    if m > 0:
        nodal_diameters.append(m * N - k)
    nodal_diameters.append(m * N + k)

print("Nodal Diameters :")
for d in nodal_diameters:
    if d > n_blades:  # ignore
        continue
    elif d > n_blades // 2:  # back alias
        print("%4d" % -(n_blades - d))
    else:
        print("%4d" % d)
Nodal Diameters :
   1
   5
   7
  11
 -11
  -7
  -5
  -1
Plot the Multi-Bladed Sector#
We can verify these results by analyzing a multi-sector rotor
multi_blade_rotor = examples.download_academic_rotor_4blade_result()

# plot all the sectors
_ = multi_blade_rotor.plot_sectors(
    cpos="xy", scalar_bar_args={"title": "Sector"}, smooth_shading=True, cmap="bwr"
)
/home/runner/work/pymapdl-reader/pymapdl-reader/.venv/lib/python3.14/site-packages/ansys/mapdl/reader/cyclic_reader.py:1993: PyVistaFutureWarning: The default value of `algorithm` for the filter
`UnstructuredGrid.extract_surface` will change in the future. It currently defaults to
`'dataset_surface'`, but will change to `None`. Explicitly set the `algorithm` keyword to
silence this warning.
  surf_sector = grid.extract_surface()
/home/runner/work/pymapdl-reader/pymapdl-reader/.venv/lib/python3.14/site-packages/ansys/mapdl/reader/cyclic_reader.py:2003: PyVistaDeprecationWarning:
/home/runner/work/pymapdl-reader/pymapdl-reader/.venv/lib/python3.14/site-packages/ansys/mapdl/reader/cyclic_reader.py:2003: Argument 'deep' must be passed as a keyword argument to function 'DataObject.copy'.
From version 0.50, passing this as a positional argument will result in a TypeError.
  surf_sector.copy(False), scalars=sector_scalars, **kwargs
/home/runner/work/pymapdl-reader/pymapdl-reader/.venv/lib/python3.14/site-packages/ansys/mapdl/reader/cyclic_reader.py:2003: PyVistaDeprecationWarning:
/home/runner/work/pymapdl-reader/pymapdl-reader/.venv/lib/python3.14/site-packages/ansys/mapdl/reader/cyclic_reader.py:2003: Argument 'deep' must be passed as a keyword argument to function 'DataObject.copy'.
From version 0.50, passing this as a positional argument will result in a TypeError.
  surf_sector.copy(False), scalars=sector_scalars, **kwargs
/home/runner/work/pymapdl-reader/pymapdl-reader/.venv/lib/python3.14/site-packages/ansys/mapdl/reader/cyclic_reader.py:2003: PyVistaDeprecationWarning:
/home/runner/work/pymapdl-reader/pymapdl-reader/.venv/lib/python3.14/site-packages/ansys/mapdl/reader/cyclic_reader.py:2003: Argument 'deep' must be passed as a keyword argument to function 'DataObject.copy'.
From version 0.50, passing this as a positional argument will result in a TypeError.
  surf_sector.copy(False), scalars=sector_scalars, **kwargs
/home/runner/work/pymapdl-reader/pymapdl-reader/.venv/lib/python3.14/site-packages/ansys/mapdl/reader/cyclic_reader.py:2003: PyVistaDeprecationWarning:
/home/runner/work/pymapdl-reader/pymapdl-reader/.venv/lib/python3.14/site-packages/ansys/mapdl/reader/cyclic_reader.py:2003: Argument 'deep' must be passed as a keyword argument to function 'DataObject.copy'.
From version 0.50, passing this as a positional argument will result in a TypeError.
  surf_sector.copy(False), scalars=sector_scalars, **kwargs
/home/runner/work/pymapdl-reader/pymapdl-reader/.venv/lib/python3.14/site-packages/ansys/mapdl/reader/cyclic_reader.py:2003: PyVistaDeprecationWarning:
/home/runner/work/pymapdl-reader/pymapdl-reader/.venv/lib/python3.14/site-packages/ansys/mapdl/reader/cyclic_reader.py:2003: Argument 'deep' must be passed as a keyword argument to function 'DataObject.copy'.
From version 0.50, passing this as a positional argument will result in a TypeError.
  surf_sector.copy(False), scalars=sector_scalars, **kwargs
/home/runner/work/pymapdl-reader/pymapdl-reader/.venv/lib/python3.14/site-packages/ansys/mapdl/reader/cyclic_reader.py:2003: PyVistaDeprecationWarning:
/home/runner/work/pymapdl-reader/pymapdl-reader/.venv/lib/python3.14/site-packages/ansys/mapdl/reader/cyclic_reader.py:2003: Argument 'deep' must be passed as a keyword argument to function 'DataObject.copy'.
From version 0.50, passing this as a positional argument will result in a TypeError.
  surf_sector.copy(False), scalars=sector_scalars, **kwargs
We can then see that the harmonic indices for harmonic index 1 indeed alias back to the expected nodal diameters in the following plots.
print(multi_blade_rotor.harmonic_indices)

hi_1 = np.nonzero(multi_blade_rotor.harmonic_indices == 1)[0]
print("Cumulative indices matching harmonic index 1:", hi_1)
[ 0  0  0  0  0  0  0  0  1 -1  1 -1 -1  1 -1  1 -2  2 -2  2 -2  2 -2  2
  3  3  3  3  3  3  3  3]
Cumulative indices matching harmonic index 1: [ 8 10 13 15]
Cumulative result 8 and harmonic index 1
/home/runner/work/pymapdl-reader/pymapdl-reader/.venv/lib/python3.14/site-packages/ansys/mapdl/reader/cyclic_reader.py:1993: PyVistaFutureWarning: The default value of `algorithm` for the filter
`UnstructuredGrid.extract_surface` will change in the future. It currently defaults to
`'dataset_surface'`, but will change to `None`. Explicitly set the `algorithm` keyword to
silence this warning.
  surf_sector = grid.extract_surface()
/home/runner/work/pymapdl-reader/pymapdl-reader/.venv/lib/python3.14/site-packages/ansys/mapdl/reader/cyclic_reader.py:2003: PyVistaDeprecationWarning:
/home/runner/work/pymapdl-reader/pymapdl-reader/.venv/lib/python3.14/site-packages/ansys/mapdl/reader/cyclic_reader.py:2003: Argument 'deep' must be passed as a keyword argument to function 'DataObject.copy'.
From version 0.50, passing this as a positional argument will result in a TypeError.
  surf_sector.copy(False), scalars=sector_scalars, **kwargs
Cumulative result 10 and harmonic index 5
/home/runner/work/pymapdl-reader/pymapdl-reader/.venv/lib/python3.14/site-packages/ansys/mapdl/reader/cyclic_reader.py:1993: PyVistaFutureWarning: The default value of `algorithm` for the filter
`UnstructuredGrid.extract_surface` will change in the future. It currently defaults to
`'dataset_surface'`, but will change to `None`. Explicitly set the `algorithm` keyword to
silence this warning.
  surf_sector = grid.extract_surface()
/home/runner/work/pymapdl-reader/pymapdl-reader/.venv/lib/python3.14/site-packages/ansys/mapdl/reader/cyclic_reader.py:2003: PyVistaDeprecationWarning:
/home/runner/work/pymapdl-reader/pymapdl-reader/.venv/lib/python3.14/site-packages/ansys/mapdl/reader/cyclic_reader.py:2003: Argument 'deep' must be passed as a keyword argument to function 'DataObject.copy'.
From version 0.50, passing this as a positional argument will result in a TypeError.
  surf_sector.copy(False), scalars=sector_scalars, **kwargs
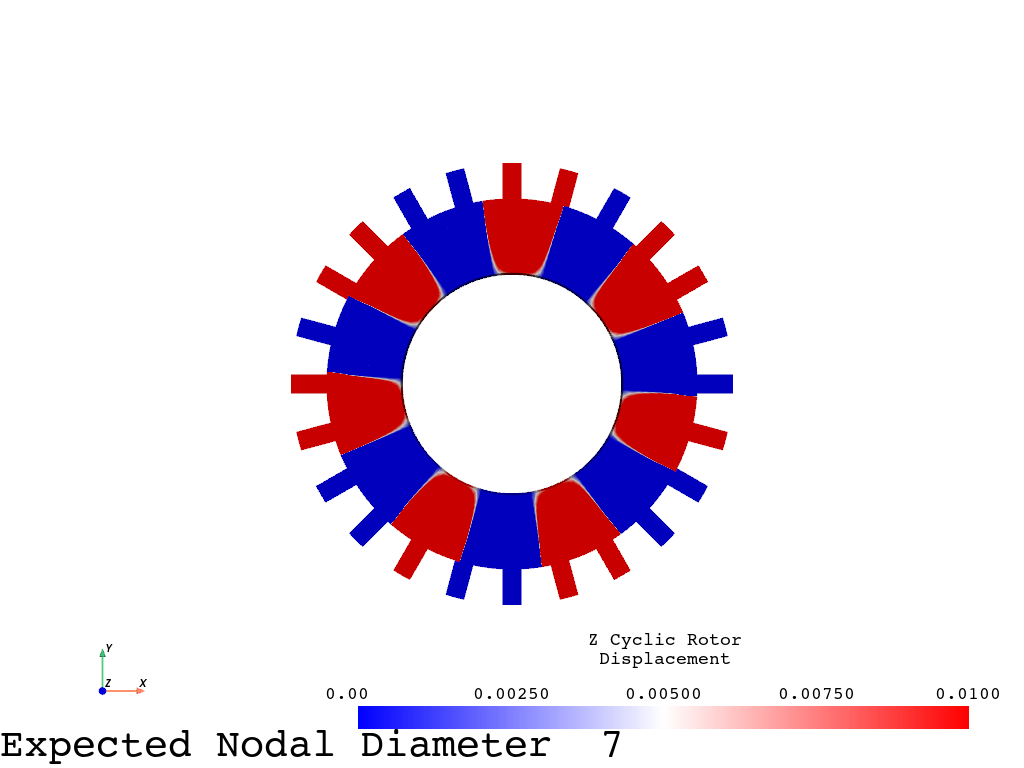
Cumulative result 13 and harmonic index 7
/home/runner/work/pymapdl-reader/pymapdl-reader/.venv/lib/python3.14/site-packages/ansys/mapdl/reader/cyclic_reader.py:1993: PyVistaFutureWarning: The default value of `algorithm` for the filter
`UnstructuredGrid.extract_surface` will change in the future. It currently defaults to
`'dataset_surface'`, but will change to `None`. Explicitly set the `algorithm` keyword to
silence this warning.
  surf_sector = grid.extract_surface()
/home/runner/work/pymapdl-reader/pymapdl-reader/.venv/lib/python3.14/site-packages/ansys/mapdl/reader/cyclic_reader.py:2003: PyVistaDeprecationWarning:
/home/runner/work/pymapdl-reader/pymapdl-reader/.venv/lib/python3.14/site-packages/ansys/mapdl/reader/cyclic_reader.py:2003: Argument 'deep' must be passed as a keyword argument to function 'DataObject.copy'.
From version 0.50, passing this as a positional argument will result in a TypeError.
  surf_sector.copy(False), scalars=sector_scalars, **kwargs
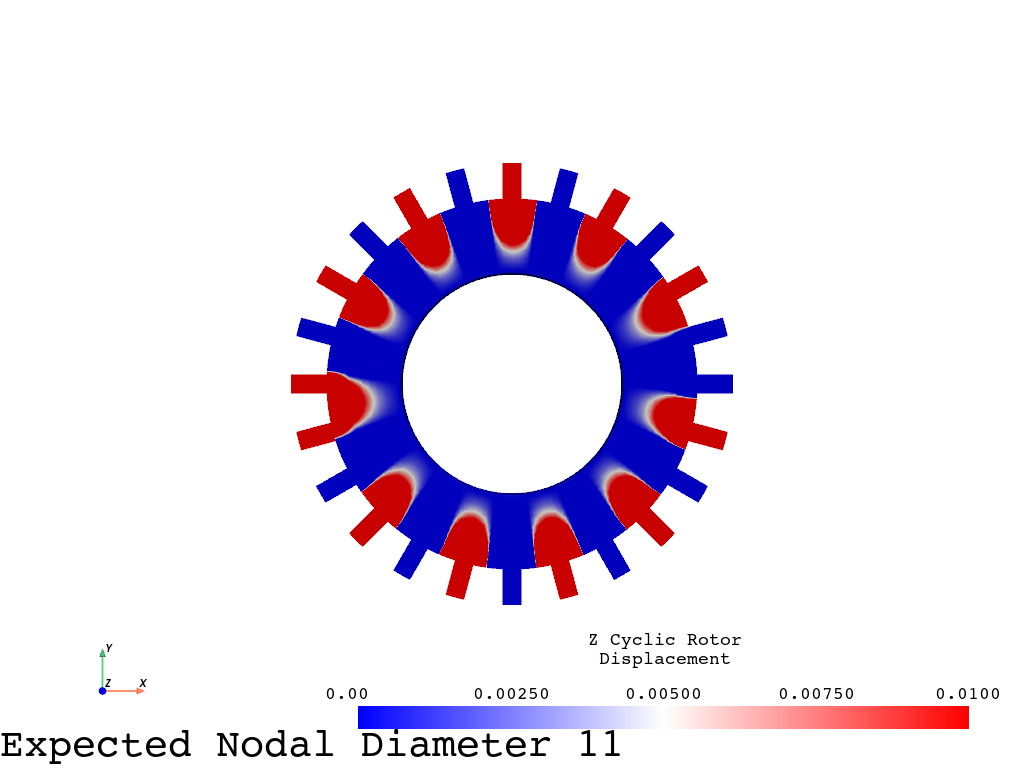
Cumulative result 15 and harmonic index 11
/home/runner/work/pymapdl-reader/pymapdl-reader/.venv/lib/python3.14/site-packages/ansys/mapdl/reader/cyclic_reader.py:1993: PyVistaFutureWarning: The default value of `algorithm` for the filter
`UnstructuredGrid.extract_surface` will change in the future. It currently defaults to
`'dataset_surface'`, but will change to `None`. Explicitly set the `algorithm` keyword to
silence this warning.
  surf_sector = grid.extract_surface()
/home/runner/work/pymapdl-reader/pymapdl-reader/.venv/lib/python3.14/site-packages/ansys/mapdl/reader/cyclic_reader.py:2003: PyVistaDeprecationWarning:
/home/runner/work/pymapdl-reader/pymapdl-reader/.venv/lib/python3.14/site-packages/ansys/mapdl/reader/cyclic_reader.py:2003: Argument 'deep' must be passed as a keyword argument to function 'DataObject.copy'.
From version 0.50, passing this as a positional argument will result in a TypeError.
  surf_sector.copy(False), scalars=sector_scalars, **kwargs
Traveling Wave Animation#
You can animate the traveling wave for a cyclic result using
animate_nodal_displacement. For a modal result, be sure to
modify displacement_factor to a value that properly scales the
modal solution. Recall that solutions to a modal analysis from
MAPDL may or may not be scaled to unity or the mass matrix depending
on the settings within the modal analysis.
Set loop=True to allow for a continuous plot, and modify
n_frames to allow for a smoother or faster plot. See
help(pyvista.plot) for additional keyword arguments.
_ = rotor.animate_nodal_displacement(
    (3, 1),
    displacement_factor=0.03,
    n_frames=30,
    show_axes=False,
    background="w",
    loop=False,
    add_text=False,
    movie_filename="EO3_Mode1.gif",
)
/home/runner/work/pymapdl-reader/pymapdl-reader/.venv/lib/python3.14/site-packages/ansys/mapdl/reader/cyclic_reader.py:1707: PyVistaFutureWarning: The default value of `algorithm` for the filter
`UnstructuredGrid.extract_surface` will change in the future. It currently defaults to
`'dataset_surface'`, but will change to `None`. Explicitly set the `algorithm` keyword to
silence this warning.
  plot_mesh = self.full_rotor.extract_surface()
Note how you can plot the backwards traveling wave by selecting the
second mode in the mode pair (3, 2) instead of (3, 1).
_ = rotor.animate_nodal_displacement(
    (3, 2),
    displacement_factor=0.03,
    n_frames=30,
    n_colors=128,
    show_axes=False,
    background="w",
    loop=False,
    add_text=False,
    movie_filename="EO3_Mode1.gif",
    show_scalar_bar=False,
)
print()
/home/runner/work/pymapdl-reader/pymapdl-reader/.venv/lib/python3.14/site-packages/ansys/mapdl/reader/cyclic_reader.py:1707: PyVistaFutureWarning: The default value of `algorithm` for the filter
`UnstructuredGrid.extract_surface` will change in the future. It currently defaults to
`'dataset_surface'`, but will change to `None`. Explicitly set the `algorithm` keyword to
silence this warning.
  plot_mesh = self.full_rotor.extract_surface()
Total running time of the script: (0 minutes 16.077 seconds)